Visualise positions in a quadrant with multiple dimensions
Work format: Quadrant
A Quadrant is useful when you want to explore a topic along two dimensions.
It works well when a single scale is not enough to capture the complexity of the subject. By combining two axes, you can map how participants think across multiple aspects at the same time.
This makes it especially suitable for more complex topics, where trade-offs, priorities or different perspectives need to be explored.
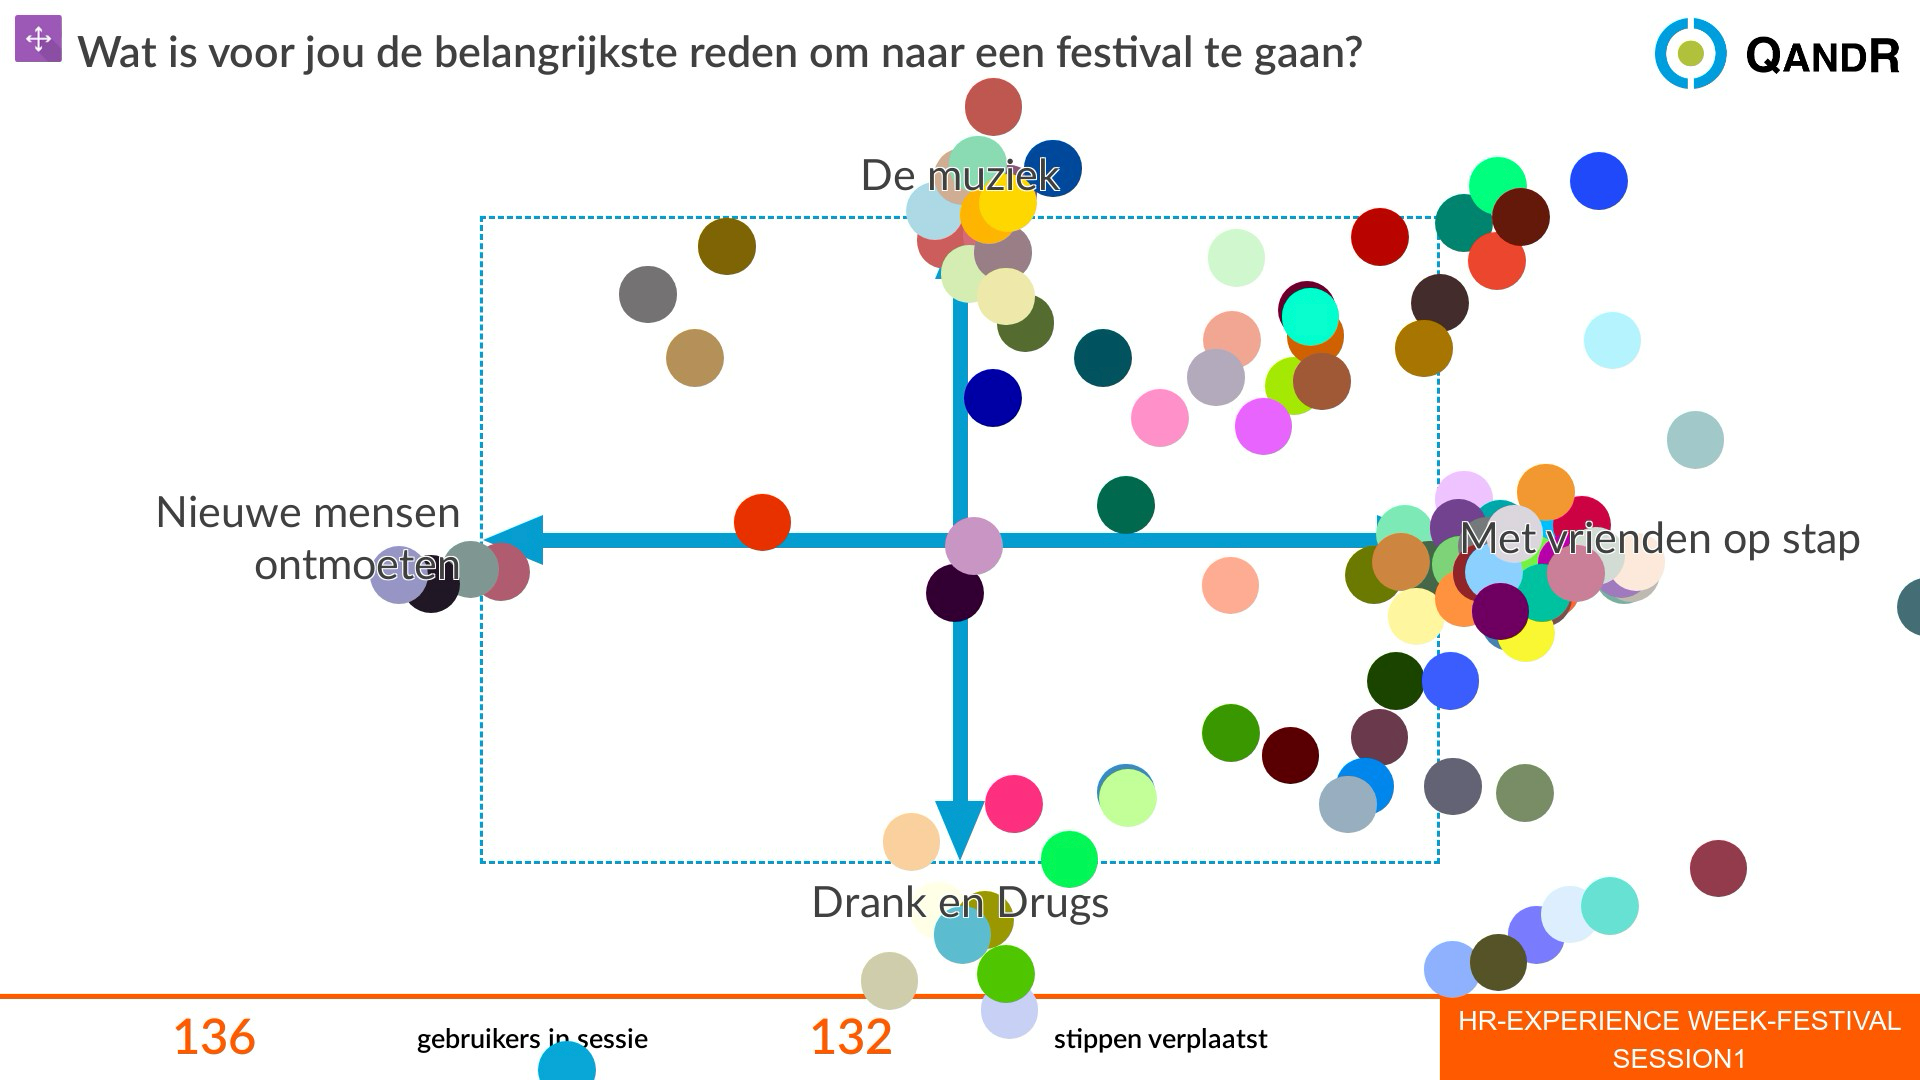
A Quadrant is an interactive format where participants position themselves within a field defined by two axes.
By placing a point, they show how they think about a topic that has multiple dimensions. This creates an immediate visual overview of opinions, differences and patterns within the group.
Because everyone first chooses a position individually, the result is more balanced and less influenced by others. This makes it easier to discuss nuances and guide the conversation in a focused way.
The Quadrant also allows you to highlight complex trade-offs, compare viewpoints and steer the discussion based on striking or contrasting positions. This makes it a powerful format for deeper exploration and decision-making.
A good Quadrant starts with two clear and meaningful axes.
Each axis should represent a dimension that is relevant to the topic. Together, they should create a field where different positions make sense and feel realistic.
Avoid vague or overlapping axes. A strong Quadrant helps participants understand what each direction represents and makes them think about trade-offs between the two dimensions.
Keep the labels clear and concrete, so participants can quickly choose a position and engage in the discussion.
Yes, this is possible using the “no peer influence” option.
When enabled, participants place their point on the Quadrant without seeing where others have responded. This ensures that everyone thinks independently first.
On the main screen, you will only see that responses are coming in — not where they are placed. The axes remain visible, but the positions are hidden.
When you reveal the results, all points appear at once, making patterns and differences immediately visible.