QandR's visualisations make the follow-up of a session a breeze
Reporting
After completing a QandR session, researchers or moderators typically want to present session results to stakeholders, often in the form of a PDF-report. With the reporting feature you are able to select the visualisation you want to include in the report, and then generate the PDF on the fly, with the option to view it, download it, or email it to your or any other email address.

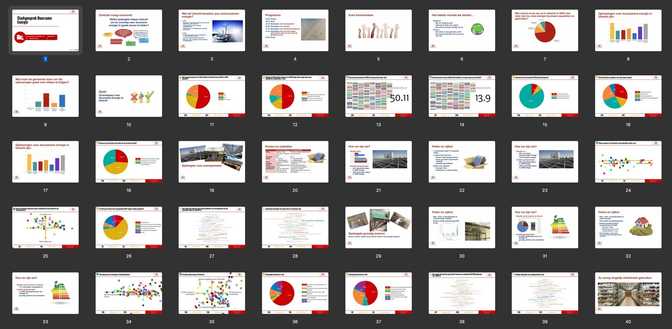
Above a snippet of of a QandR pdf report created by the municipality of Utrecht. This report contains an aggregation of 11 sessions with a total of 235 participants all being part of the New Energy City Conversation.
Check the video below to see the automatic reporting feature at work.
Right after you have completed your QandR session, and have closed it in the dashboard, QandR will prompt you to generate a PDF with selected slides from your session and view, download or email it. A simple (with lots of work under the bonnet!) but powerful addition that will make reporting your session results even easier.
Export session data to Excel
Based on this feedback from our users, we have also recently (July 2022) added the option to export the source data of a QandR session to excel. This export contains poll results, grading results, the submitted words from a word cloud (and their frequency) and all the ideas that were entered on post-it notes during a sticky notes session. See in the below video how you can export this data.